Predicting League of Legends Winner from 30 mins of Gameplay.
This post is inspired by and expands on Leonardo Fuchs's analysis on Cloud9 League of Legends matches. The data set has been generated by Chuck Efron.
This post and the complete associated code are also available to view on Kaggle.
Introduction
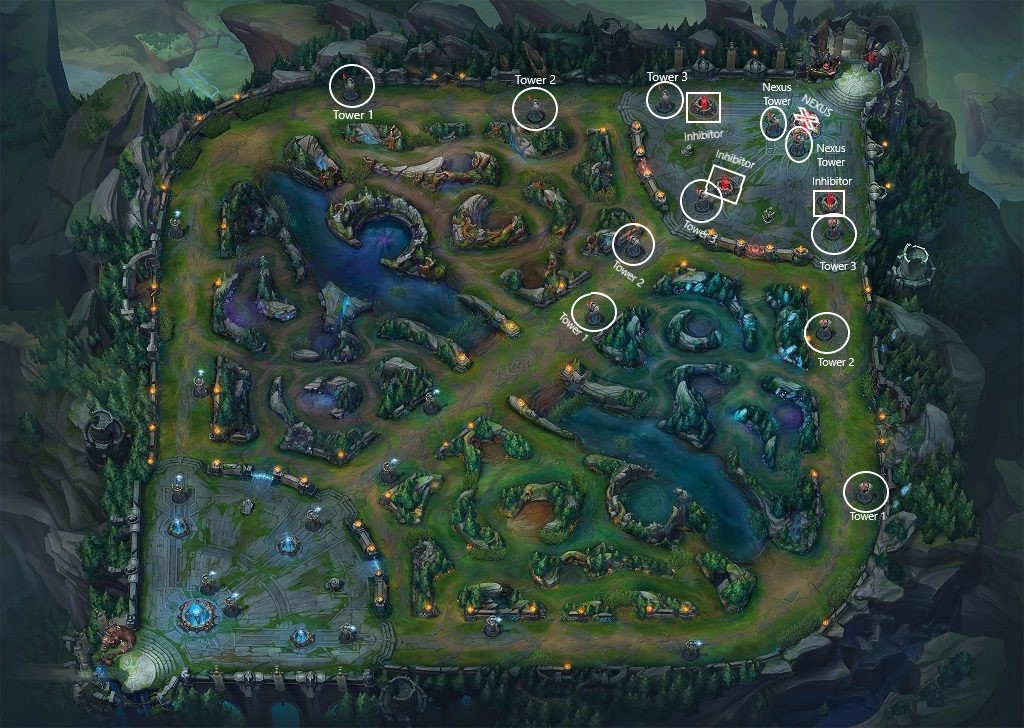
League of Legends (LoL) is a multiplayer online battle arena (MOBA) game developed by Riot Games. League of Legends gameplay most commonly takes the form of 5 vs. 5 arena matches. During these matches, the player controls a single "champion" and is assigned to a 5 player team. Their team pitted against an enemy 5 man team of human players. The two teams fight on a recurring, nearly symmetrical, square map with one team starting on the top right as the Red team, and the other starting on the bottom left as the Blue team. The goal is to take the enemy team's nexus, a structure protected by defensive turrets called towers, physical walls, and autonomous minions. The map contains many optional objectives which provide rewards to the team or player, which could improve their chances of winning the game. Killable monsters such as minions, baron, and dragon can be killed for gold or buffs. Enemy towers can be taken to allow friendly minions to creep closer to the enemy nexus and destroying enemy inhibitors makes friendly minions temporarily stronger.
Goals
Teams must efficiently choose between the various objectives to try to increase their chance of winning. Deciding which objectives are most meaningful or impactful can be a challenge, especially as taking time to secure a certain objective can result in losing a different objective to the enemy team.
We present two goals for our analysis:
- Determine which objectives are most impactful to the game outcome. Specifically, which objectives significantly increase the chances of winning the game, and which objectives, when taken by the enemy team, significantly decrease the chances of winning the game.
- After determining the most impactful objectives, we will train a classification model to predict the winner of a game based on the objectives taken by each team at the 30 minute mark.

Dataset
League of Legends features a worldwide competitive scene. To support this, Riot Games hosts the League Championship Series (LCS), a worldwide tournament series split into regions such as North America, Europe, and South Korea. The dataset includes LCS matches between 2015-2017, from NALCS, EULCS, LCK, LMS and CBLoL, and the World Championship and Mid-Season Invitational tournaments. The dataset was generated by Chuck Efron and is available on Kaggle here.
Like Fuchs, we will analyze a subset of the available columns. The columns and their descriptions are provided.
- blueTeamTag Blue Team's tag name (ex. Team SoloMid is TSM)
- bResult Result of the match for Blue Team: 1 is a win, 0 is a loss
- goldblue Blue Team's total gold value by minute
- bKills List of Blue Team's kills - [Time in minutes, Victim, Killer, Assist1, Assist2, Assist3, Assist4, x_pos, y_pos]
- bTowers List of minutes that Blue Team destroyed a tower and Tower Location
- bInhibs List of minutes that Blue Team destroyed an inhibitor and Location
- bDragons List of minutes that Blue Team killed a dragon
- bBarons List of minutes that Blue Team killed a baron
- bHeralds List of minutes that Blue Team killed a rift herald
- redTeamTag Red Team's tag name (ex. Cloud9 is C9)
- bResult Result of the match for Red Team: 1 is a win, 0 is a loss
- goldblue Red Team's total gold value by minute
- bKills List of Red Team's kills - [Time in minutes, Victim, Killer, Assist1, Assist2, Assist3, Assist4, x_pos, y_pos]
- bTowers List of minutes that Red Team destroyed a tower and Tower location
- bInhibs List of minutes that Red Team destroyed an inhibitor and location
- bDragons List of minutes that Red Team killed a dragon
- bBarons List of minutes that Red Team killed a baron
- bHeralds List of minutes that Red Team killed a rift herald
Figure: Displaying a few rows of the Blue team predictor variables before cleaning.
Data Cleaning
Our steps for preparing data for exploration and model:
Change data types to more workable data types.
Most of the data are Pandas objects.
The columns which capture the time-series of a variable are turned into Python lists, i.e. list of lists with two elements: each kill and its time-stamp.
The columns with just a number are transformed into Integers or Floats.
Take only the first 30 minutes of Gameplay.
From the time-series columns, we’ll remove any objectives taken or earned after 30 minutes.
Sum time-series data points to produce a total count for that variable.
Example: Kills are presented as a list of each kill with a time-stamp. The count of kills is computed for analysis.
Create a binary winner column.
If blue wins, winner = 1.
If red wins, winner = 2.
After cleaning, the data set appears as follows:
Explore the Dataset
Now that the dataset is cleaned and ready for exploration, the objectives we will analyze are described below. These objectives are typically sought after and help the team toward their goal of destorying their enemy's nexus. These objectives are:
- Gold: Gold can be earned by killing players, monsters, minions, and constructs. Certain items or champions provide increased Gold earnings. A small amount of Gold is also placed into every players' inventory every second.
- Player kills: Killing enemy players provides Gold in addition to disabling the enemy player until they respawn. Depending on the game version, killing players with many kills earns more Gold, and killing players with many deaths provides less Gold.
- Towers kills: Towers defend the lanes and base of each team. Towers deal major damage to enemy creeps and players. Two of the Eleven Towers are referred to as the inner towers and specifically defend the nexus.
- Inhibitor kills: Three Inhibitors are found in each base. Destroying an enemy inhibitor temporarily empowers your minions before the inhibitor repairs itself and must be destroyed again. Importantly, your nexus cannot be destroyed while a friendly inhibitor stands.
- Dragon kills: The Dragon is a powerful monster on the map. The Dragon can be killed to provide a large amount of gold and various buffs to your team. The Dragon respawns regularly and may provide a different buff each time.
- Baron kills: The Baron is the most powerful monster on the map, and is more difficult to kill than dragon. Killing Baron provides your team one of the strongest buffs in the game, and additionally allows you to empower friendly minions as they siege the enemy nexus.
- Herald kills: The Rift Herald spawns only twice and only early in the game. Killing the Rift Herald allows you to summon the Rift Herald, who then inflicts major damage to an enemy structure. The Rift Herald can only be found on the map until 19:45 gametime, after which Baron takes her place.
We will analyze these objectives as possible predictors for winning or losing the game.
Figure: The top of the in-game scoreboard displays player kills, tower kills, and dragon kills for each team. From /u/ar414-com
Heat Map
The heat map presents the correlation between each of our variables. By averaging across the Blue and the Red teams, we find that the correlation between each objective and winning are:
Towers Destroyed: ~0.52 (Moderate Correlation)
Gold Earned: ~.50 (Moderate Correlation)
Dragons Killed: 0.46 (Moderate Correlation)
Barons Killed: 0.40 (Moderate Correlation)
Kills: ~0.36 (Weak Correlation)
Inhibitors Destroyed: 0.27 (Weak Correlation)
Heralds Killed: 0.09 (Weak Correlation)
We find positive correlations between all objectives and winning, with Towers and Gold having the highest strength correlations.
Access Multicollinearity: Compute VIF
Our heat map shows Blue and Red dragon kills feature a notably high correlation. Let’s compute the variance inflation factor (VIF) between our predictor variables and access multicollinearity before training our model.
We see that Red and Blue dragon kills do not have high VIF. However, we find that Blue team gold and Red team gold at the 30-minute mark to have high VIF:
Blue Team End Gold VIF = 5.98
Red Team End Gold VIF = 6.38
This makes sense as a team’s gold increases when taking any of the other objectives, both teams passively earn gold at an equal rate, and there are only a few other sources of team gold that are not accounted for here. To reduce the possibility of multicollinearity between our predictors, we'll drop blue_end_gold and red_end_gold before training our model.
Train Classification Model
Split the Data
We will use scikit-learn to split the data, so that we can train on 66.6% of the data and test on the remaining 33.3% to assess accuracy.
Logistic Regression Model using statsmodels
We will fit a logistic regression model to the training data. We can then view the results and compute the increase in odds when increasing any of the objectives by 1.
As required by statsmodels, the winner variable will be transformed to 0s and 1s, instead of 1s and 2s.
From the returned coefficients, we’ll compute the odds-ratios:
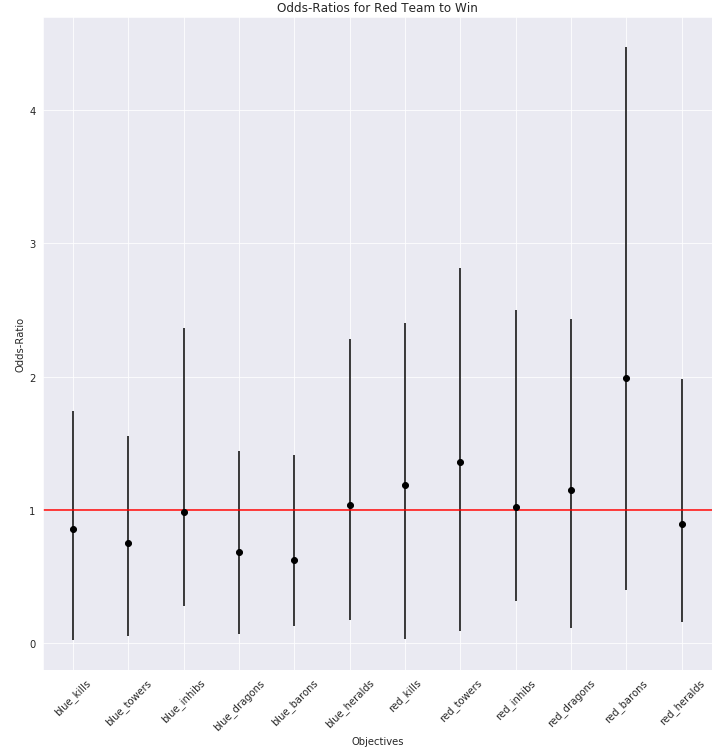
Figure: The odds-ratios with 95% confidence intervals for all objectives, for the Red team to win the game. Points above the red line represent an increase in odds for Red team to win the game when the objective count increases, and points below the red line represent a decrease in odds for the Blue team to win the game when the objective count increases.
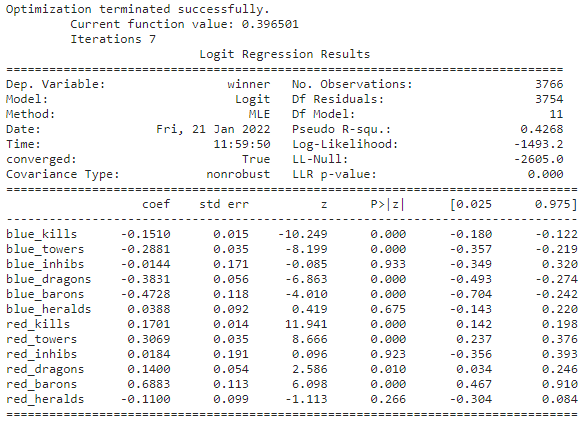
The logistic regression was used to analyze the relationship between objectives taken before 30 minutes and winning a game. The results are described in the above table. Odds-ratios with a 95% confidence interval for all predictors are computed.
Let's envision ourselves as the Red team to describe how objectives taken or given up before 30 minutes impact the odds of winning a game. The results of the logistic regression show the following significant relationships between a given predictor and winning the game, holding all other predictors constant:
For each player kill, the odds of winning are expected to increase by 18% (95% CI [15%, 22%]).
For each tower destroyed, the odds of winning are expected to increase by 35% (95% CI [26%, 46%]).
For each dragon killed, the odds of winning are expected to increase by 15% (95% CI [3%, 28%]).
For each baron killed, the odds of winning are expected to increase by 99% (95% CI [60%, 148%]).
Considering objectives given up to the enemy team:
For each kill given up to the enemy team, the odds of winning are expected to decrease by 14% (95% CI [11%, 16%]).
For each tower lost, the odds of winning are expected to decrease by 25% (95% CI [20%, 30%]).
For each dragon taken by the enemy team, the odds of winning are expected to decrease by 32% (95% CI [24%, 39%]).
For each baron taken by the enemy team, the odds of winning are expected to decrease by 38% (95% CI [21%, 50%]).
Evaluate the Model
We’ll evaluate the model’s predictions of match outcomes on the unseen test data.
Predict Outcome of a Specific Game
Let's predict the winner for the 17th game in the data dataset. Winterfox (WFX, Red team) wins, defeating Team Dignitas (DIG, Blue team) in a 40 minute game, let's predict the winner based on the objectives taken in the first 30 minutes.
The model computes a 96% probability for Red team to win the game, accurately predicting the Red team's win.
Overall, we were able to train a logistic regression model to predict the outcome of competitive League of Legends matches with 81.9% accuracy.
Discussion
Goal. In this analysis, we aimed to determine the major factors which lead to winning or losing a League of Legends game, and attempt to predict the winner of a game based on objectives taken or given up before 30 minutes.
Models. We were able to train a logistic regression model to predict the winner of competitive League of Legends games based on the objectives taken or given up before 30 minutes. We trained two models, one utilizing statsmodels and one utilizing scikit-learn. Despite only accessing the first 30 minutes of gameplay, both models were able to predict the future winner to ~80% accuracy.
Applications. These models such as the ones developed here could be utilized by Riot while broadcasting competitive League of Legends games to present informative predictions of the winner of a match as the match progresses in real time. Additionally, amateur players are allowed to use 3rd-party applications while playing League of Legends matches. Building these models into a 3rd-party application could inform players of their odds of winning their current game, allowing them to make a more informed decision to either fight on or surrender early. These 3rd-party applications could also describe the impact of map objectives on their odds of winning the game, in order to help a team decide their next moves.
Findings. The correlation heatmap suggests winning is moderately correlated between towers taken, gold earned, and dragons and barons killed. The odds-ratios computed from the logistic regression model suggest players killed, towers destroyed, barons killed and dragons killed to increase the odds of winning the game. Corroborating these findings, it is clear that towers destroyed, baron kills, dragon kills are highly impactful objectives to secure before 30 minutes. These results could inform efficient decision-making during a game. For example, a team could more effectively increase their odds of winning by choosing to slay a Dragon rather than a Herald, or by preparing to kill Baron rather than chasing a singular enemy player kill.
Conclusions
We draw a few notable conclusions:
Baron and dragon kills are highly impactful objectives to secure before 30 minutes to increase odds of winning the game. These map monsters could be prioritized over towers or champion kills (i.e. thirsting) to more efficiently improve a team's odds of winning.
Securing an objective as the Red team and denying that objective to the enemy Blue team have different impacts on the winning. This could be due to slight differences in the position of objectives on the map, relative to the Red and Blue bases. For example, Baron spawns on the Blue side of the river (the map's midline), making it more difficult for the Red team to secure. This could explain why Red team taking Baron leads to a greater increase in winning odds than the Blue team taking Baron. This is corroborated by the opposite position of Dragon and opposite relative impact on odds when slaying Dragon.
The current models predict based on objective counts with no sensitivity to the time that objectives were taken. However, certain objectives may be more or less meaningful at different time points throughout the game, possibly due to game mechanics such as first-blood gold or (in certain patches) turret plating awards. Analyzing the correlation between objectives and win outcome across time could offer useful insights towards how the impact of an objective changes from early-, mid-, to late-game. Additionally, the time course of captured objectives could be better modeled using a long short-term memory network or recurrent neural net, possibly leading to more accurate predictions of match outcomes.
Be clear, be confident and don’t overthink it. The beauty of your story is that it’s going to continue to evolve and your site can evolve with it. Your goal should be to make it feel right for right now. Later will take care of itself. It always does.
Thank you for reading! Again, many thanks for the examples and inspiration from Leonardo Fuchs.
As a long-time (but casual) League of Legends player, I was excited to practice some data science techniques on a familiar domain and dataset. It was eye-opening to put odds-ratio estimates to the experience of taking certain objectives — often it feels like taking Baron or a tower is extremely meaningful, and it’s somewhat validating to see the model predict the same! I’m satisfied with how comfortable the pandas work was for this section, especially in the data cleaning stage, after putting in regular practice for the past few years. This was one of my first applications of the statsmodels package as well, I’m excited to continue practicing with this package as I foray deeper into data science.
I welcome any and all constructive feedback! Please don’t hesitate to reach out to my email or LinkedIn below.


